Localytics is open-sourcing Shamer, a service which provides gamified code coverage and automatic Github integration while allowing you to question your sense of self-worth as a developer. Check out the project on Github, and read on for the story of its inception: how Shamer transitioned from a simple what if to a valued part of our engineering culture.
It all started fairly innocuously.
“What if we could click to view the coverage reports right from the pull request?”
The conversation of the moment was about the code coverage reports that get generated automatically every time our test suite passes on Codeship, one of the solutions the frontend team uses at Localytics for continuous integration. These reports let us know exactly what parts of our codebase are covered by tests, and how much of it remains untested. As our venerable Engineering Director Adam Buggia is often heard saying, “we at Localytics have a culture of testing”; the ability to get instant feedback on the status of our tests is crucial to our development pipeline.
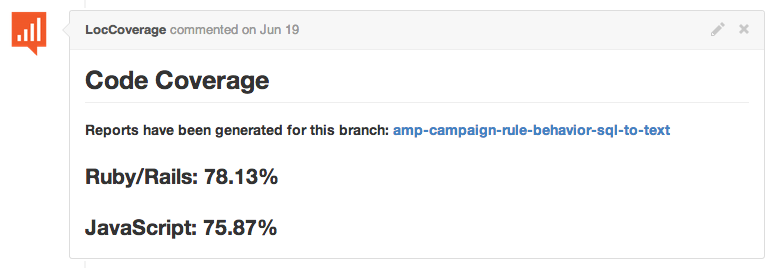
In order to make it as easy as possible for developers to review new code, we wanted to inline a summary of these coverage reports, as well as provide a link to a detailed break-down. I decided to take inspiration from Stager, a Docker-based internal service which comments on new pull requests with a link to an automatically generated staging environment. My new microservice would generate coverage reports, host them in a central location, and comment with a link to the hosted reports.
"Yasyf built a simple service to use Github auth to get access to temporary S3 tokens."
It soon became apparent that a good solution was to upload the HTML files generated by SimpleCov and Istanbul to an Amazon S3 bucket directly from Codeship. A small service with a single endpoint, running on Heroku, would take care of commenting on the PR. All viewing authentication would be handled by Github, based on organization membership and push permission for a specific repo; the people who had access to the code would also be able to view the coverage reports. Along the way, we somehow developed the notion that a service which ties together Github and arbitrary stuff stored on S3 would be a useful thing to make public. A few hours later, github-s3-auth was born.
The first iteration of github-s3-auth was fairly simple:
- Check that you are part of the Localytics organization on Github
- Check that you have push permission for the repo
- Redirect you to the S3 link you requested
Combined with some PyGithub hackery, we had exactly what we set out to build. Developers had easy access to code coverage for their latest branches, omissions in tests were easy to spot, and everyone was happy.
"Well what if we could keep track of changes, so we know who isn’t writing tests?"
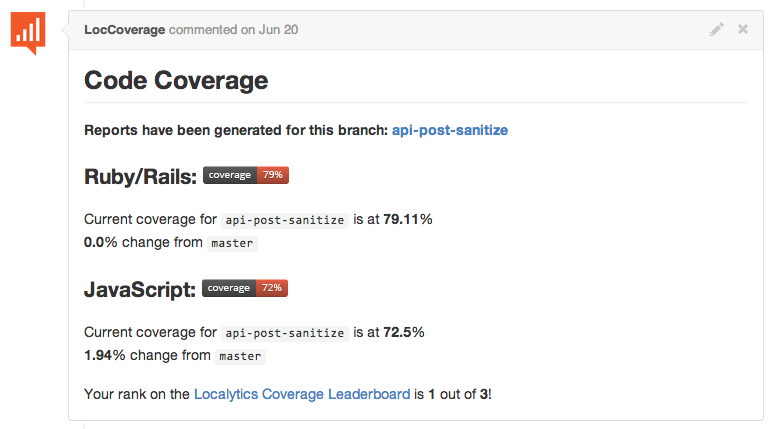
Well, almost everyone. Adam takes company culture very seriously, and suggested that it would be a good idea to add coverage deltas in the comment on Github, so everyone knew exactly what the code in front of them was doing to our overall coverage percentage. In hindsight, those who half-jokingly agreed with him may not have truly wanted to turn coverage into a competition, but it was too late.
"This should keep things interesting!"
Our Github/S3 authentication app was about to take on a whole new purpose in life. As Inception taught us, “once an idea has taken hold of the brain it's almost impossible to eradicate.” A few lines of Python, a quick MongoDB instance, and presto! The Localytics Code Coverage Leaderboard had come to life. PRs now had detailed statistics (otherwise known as simple deltas) about their coverage, and a note, forever ingrained in the sands of Github Comments, on the author’s leaderboard rank.
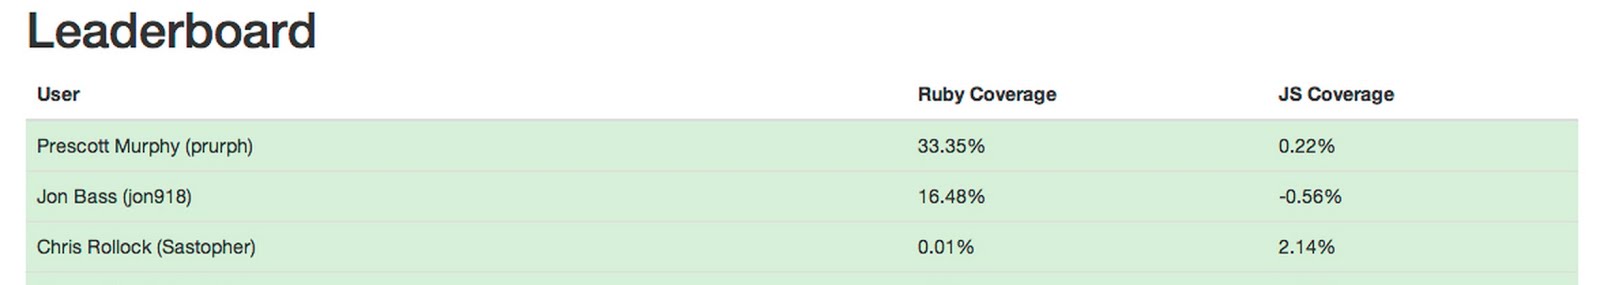
Everyone was ranked based on their cummulative coverage contribution to date, sortable by coverage for a certain language. There was no way to validate the totals; all one could do is scrutinize the ranking table and wonder why they were in the red, or what exactly caused their coverage to drop by an astounding 1.2%. It was around this time that the questions began flooding in.
“So jokes aside, how is this calculated?”
“How do I get my code from like 4 months ago counted in here? I must have an easy 20% ruby increase on that one.”
“If multiple people contribute to a branch and write a whole bunch of tests we all win, BUT who gets the code coverage points?”
“Can we see the breakdown of which PRs are impacting our coverage?”
“I think our coverage bot needs some coverage.”
These were all very good points, and it became apparent that when you make something a competition, people get very serious very quick. This was great for Adam (and company culture), but was less great for the person who had hacked everything together in a night, especially when things started to go wrong. I’ll admit, the ranking algorithm was not the most sophisticated thing in the world, nor was the leaderboard very secure. In fact, it was something along the lines of the following.
ruby_delta = request.args.get(‘ruby’) - branches[‘master’].get(‘ruby’)
js_delta = request.args.get(‘js’) - branches[‘master’].get(‘js’)
contributions[request.args.get(‘username’)] += ruby_delta + js_delta
Which, believe it or not, was rather prone to bugs. Many coverage reports left people confused and bewildered at their results. There were times when changing a line of HTML resulted in a drop of over 5%, and conversely instances of adding ten untested methods which boosted coverage significantly. While this was tolerable initially, things quickly got out of hand.
“There's a PR gold rush right now. Every PR is adding 16% ruby coverage.”
After waking up to the total decimation of any meaning in the leaderboard, we started talking about ways we could improve our gamified coverage setup , which was still just an addon of sorts to github-s3-auth. Around this time, it was suggested that this leaderboard be broken off into a separate project, as it no longer really had anything to do with Github, S3, or authentication.
Many feature suggestions were also made, including a drill-down view, branch-tracking (so as to be able to compare your code to the coverage of master wherever you branched off, instead of what it currently happened to be), and memes to shame those who dropped coverage too much. This last idea was particularly interesting, as it took what we were doing from a competition to outright (semi-)public shaming. Apparently, we at Localytics also have a culture of shaming, and out of the ashes of github-s3-auth, Shamer was born.
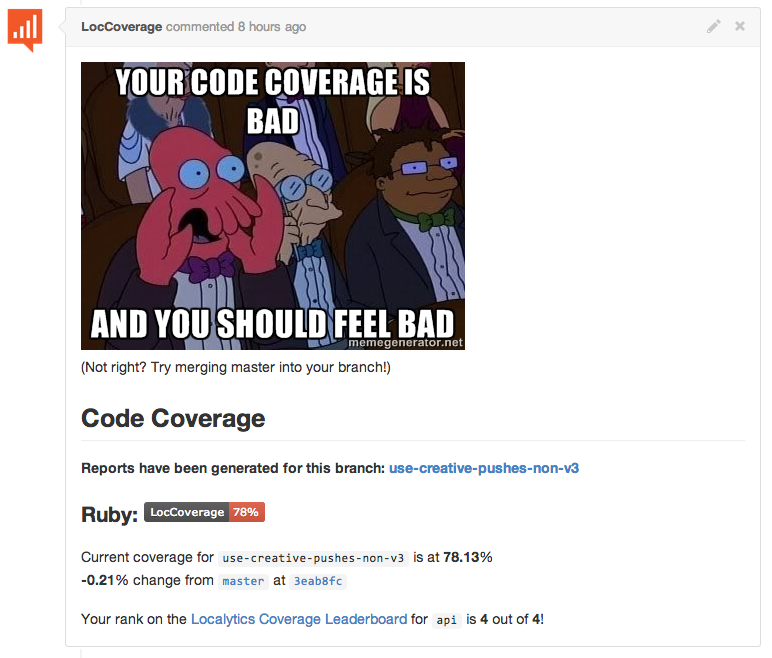
Today, Shamer is much more accurate and feature-filled. It’s used by the entire frontend team to track coverage rankings, view reports, and of course, shame people (like me) who don’t write enough tests. We feel that a tool like Shamer could have uses outside of Localytics, so we’ve open-sourced it. Feel free to check it out on Github. Pull requests and other contributions are welcomed, and don’t worry - there isn’t any shaming set up for Shamer (yet).